flowchart LR
    A[Static data] --> B[Control module]
    B --> C[Name input]
    B --> D[Year input]
    C --> E{Reactive controls}
    D --> E
    A --> F{Reactive data}
    E --> F
    F --> G[Context module]
    F --> H[Image module]
    F --> I[Info modules]
    F --> J[Map module]

    style A fill:#EBF1E4
Japan biodiversity dashboard
R
Shiny
Data Visualization
I’ve never been to Japan, but its rich culture and stunning landscapes have always amazed me. When I came across this dataset, I was curious to explore the forms of life found there, as well as those shared with other parts of the world. This dashboard offers an interactive visualization of Japan’s biodiversity from 1976 to 2024, showcasing observations of a wide variety of species.
The data used is the occurence dataset, from the Global Biodiversity Information Facility (GBIF), an international network and data infrastructure which provides open access to data about all types of life on Earth. More precisely, the dataset we’ll work on was obtained by observation.org.
You can interact with the application here!
Exploring the App
To display what kind of information we can obtain from this dataset, I’ve organized the dashboard into four key sections: Context, Timeline, Information, and Map. This structure allows you to explore the dataset from a broad perspective while also enabling a deeper investigation into occurrences of specific species.
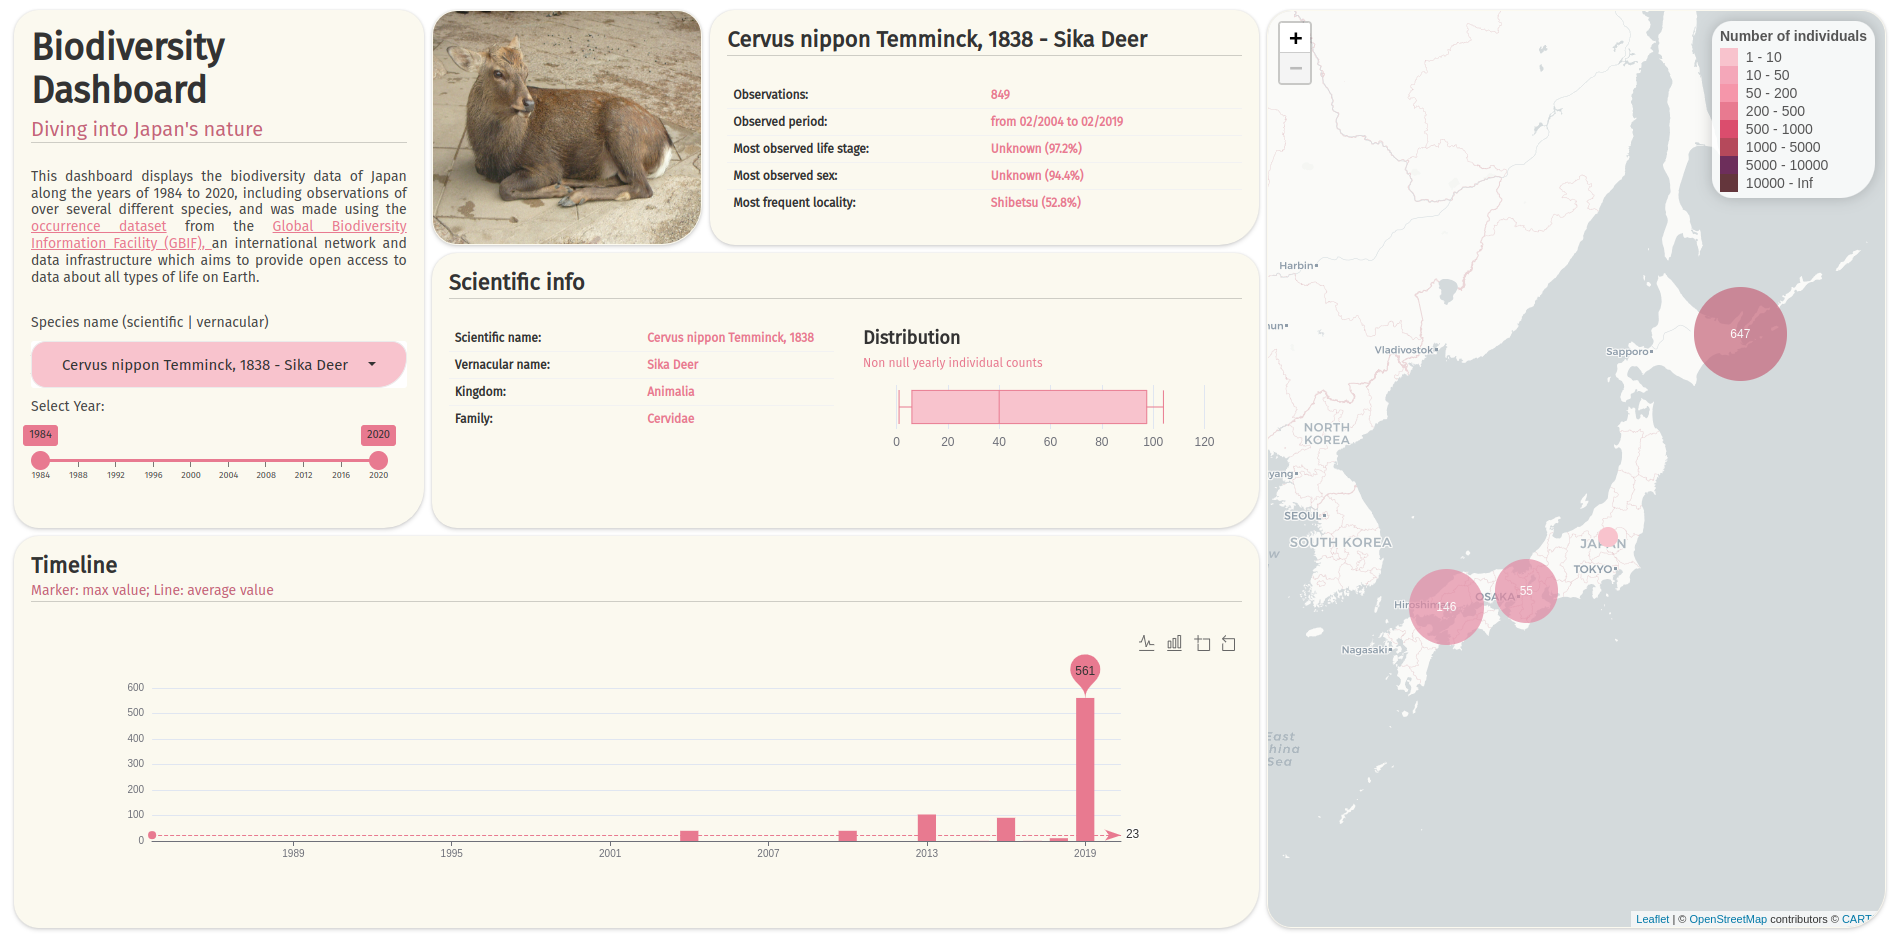
There are two display modes: the default view, that shows data for all occurrences simultaneously; and the species-filtered view, that adjusts the app’s visualizations based on the selected species. The species can be filtered either by scientific or vernacular name, using the search bar. Besides that, there’s also a filter by time period (in years), with the default range spanning from 1976 to 2024, but it can be adjusted up to a single year, which updates the entire dashboard accordingly.
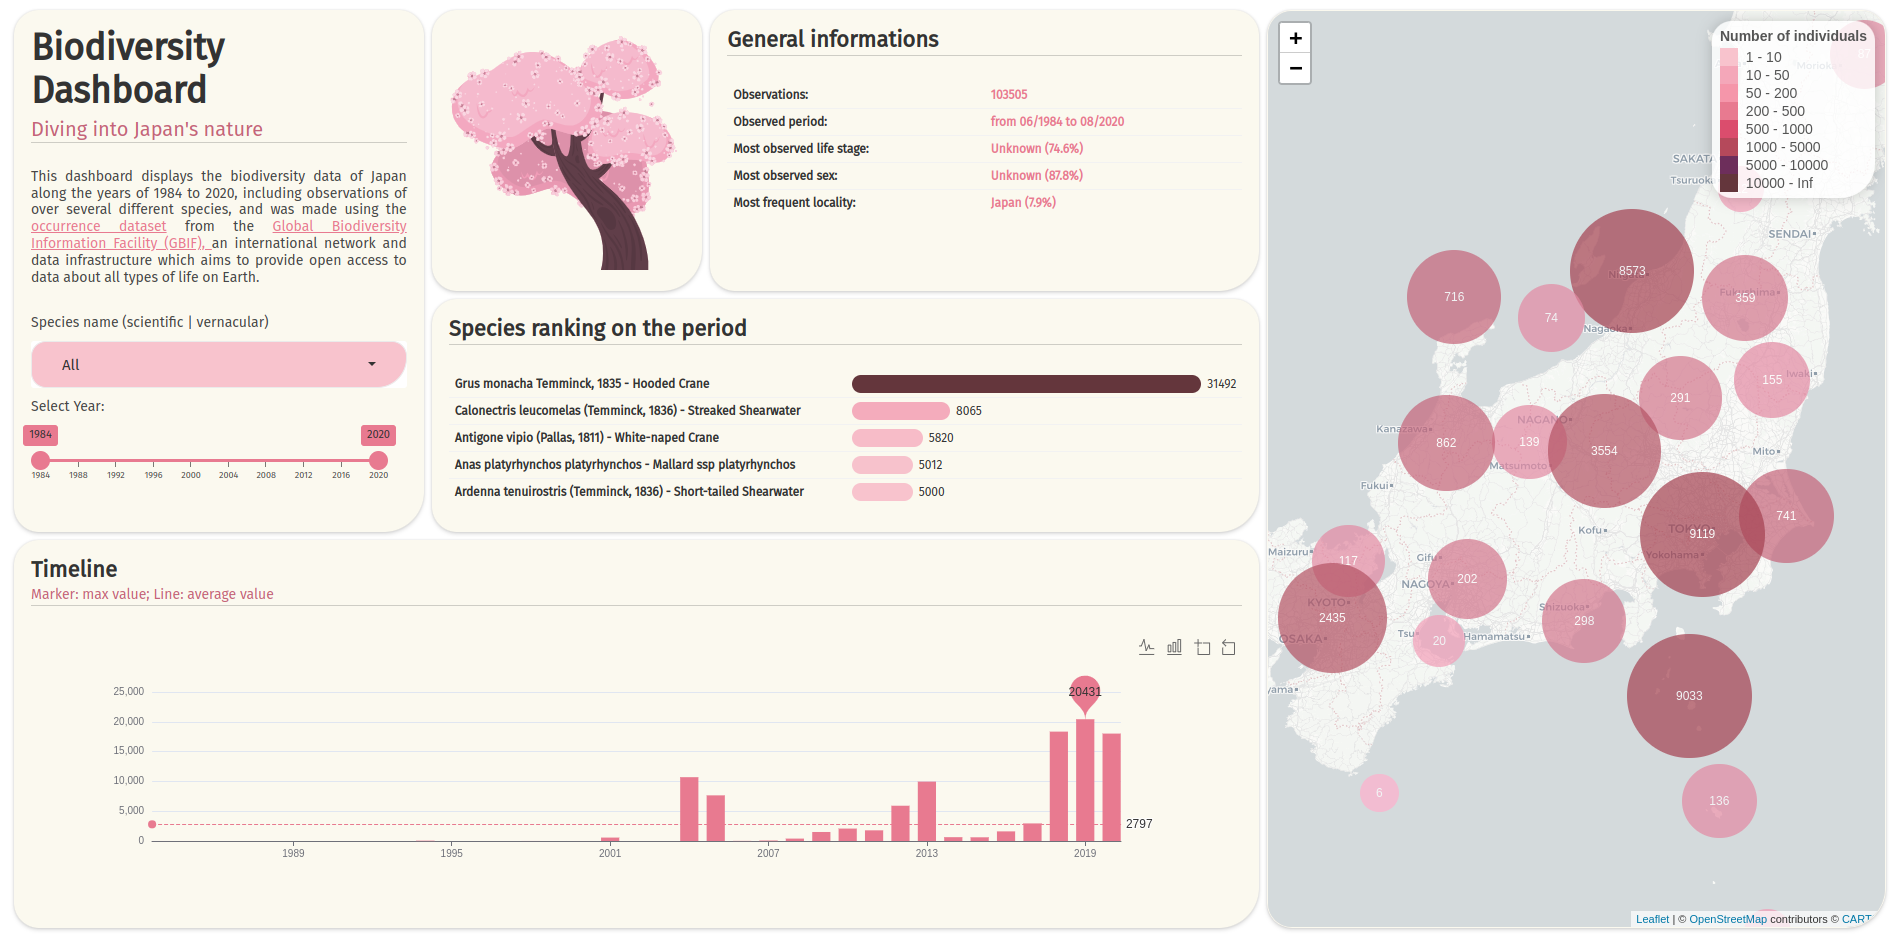
The context card: Displays an introductory text along with control selectors.
Timeline card: At the bottom, a timeline is displayed to show how many observations occurred with the filter configurations. There is a toolbox on the top to interchange between bar (default) and line plots, zoom in and zoom out.
The information cards: This part contains three cards. The first one shows an image. If a species is selected and there is a photo of it, the default image will be replaced by this photo. The second card shows general statistics about the observations: how many have occurred, and the most observed life stage, sex and locality for the species and period selected. Lastly, a ranking of the five most observed species during selected period will appear by default. If a particular species is selected, the card will swap to display all scientific information about it and a distribution box-plot of all yearly individual counts.
The map: This card shows cluster points of the observations occurred in each part of Japan during the selected period, for the selected species (and all of them, if that is the case). It can be zoomed in, and when a single observation is located, a pop-up appears by clicking, showing all the info of that particular observation and a picture of the species.
Interestingly, all the colors used in this project are traditional Japanese colors, as documented in the book “日本の伝統色 The Traditional Colors of Japan” by PIE BOOKS (2007). You can explore 250 of these colors at this link.
Project structure
I utilized an R package structure to develop and deploy this application, managing package dependencies with the renv package.
Directories and files
There is a www directory to store static files, such as css, images and fonts;
Also, there is a extdata directory to store external data, including the original dataset and the processed version used in the app;
The data-raw folder keeps the script where I did the dataset preprocessing;
The R folder contains the core scripts of the app:
- ui.R: This file sets up the page and card layouts, and includes all the necessary CSS and functionalities;
- server.R: Handles the main server logic for the app;
- functions.R: Contains pre-processing functions that get the data ready for visualization;
- plots.R: Has functions that generate the plots, like
echartsandreactable; - utils.R: Holds utility functions for smaller tasks and calculations;
- vars.R: Stores various variables, including color palettes, theme settings, custom components, and JS functions;
- widgets.R: This is where reusable UI components and input functions are stored;
- Module scripts (e.g., md_module_name.R): Contain independent shinyModules functions.
Server logic architecture
The app follows a modular reactive flow:
- Data source
- Initializes with the pre-processed static data loaded from an .rds file;
- Serves as the foundation for all downstream operations.
- Control module
- Houses user input widgets;
- Returns a reactive list containing:
- Selected names (single or “All”);
- Selected year range.
- Reactive data
- Filters the static data based on control values;
- Implements caching for performance optimization;
- Single source of truth for all visualizations that updates when control values change.
- Visualization modules
- Independent, self-contained modules consuming the filtered data;
- Each module handles a specific visualization in a card.
Unit testing
Using the testthat package, I implemented unit tests for the app’s most important functions:
Non-reactive functions: These functions in the app fall into two categories:
- Utility functions that performs simple dataframe operations (located in the
utils.Rfile); - Data transformation functions used immediately before plotting outputs, such as
echarts4rplots andreactables(found in thefunctions.Rscript).
For both types, basic structural functionalities and edge cases were covered in the test files.
- Utility functions that performs simple dataframe operations (located in the
Reactive functions: Based on the server logic structure, unit testing for reactive functions includes:
- Verifying that the control module successfully returns a reactive list with the values used to filter the app’s main reactive;
- Ensuring that the main reactive effectively filters data based on inputs from the control module.
Feel free to contribute to this project by visiting: https://github.com/jgoliv/japanbiodiversitydashboard